1 / 1
Google Charts are incorporated into some EvoNET and CMS Portal pages. I have been working mostly with Pie, Line, Column and Combo charts. The graphs are generated on the web pages using JavaScript after loading Google Chart libraries. I have integrated the charts in VB.NET and C#.NET which is worth noting since both need different approaches to properly display the data. Examples of Google Charts usage:
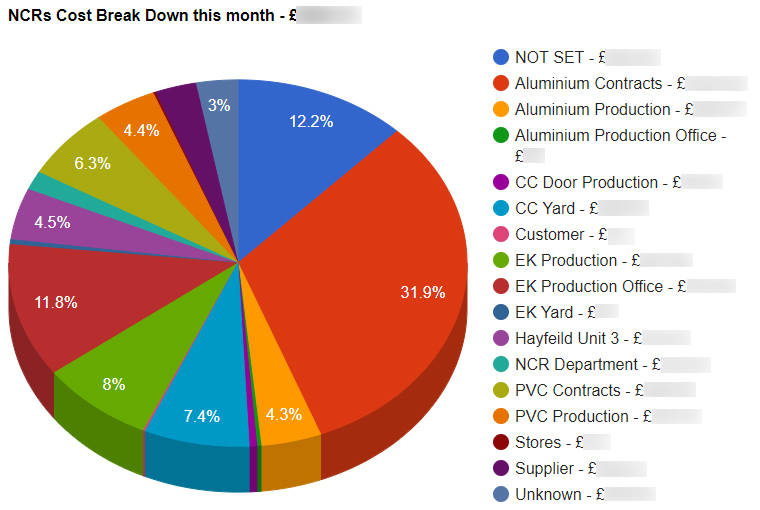
Pie chart - used to display costs of faults for the current month grouped by departments. The pie chart is integrated into EvoNET's main page.
VB.NET
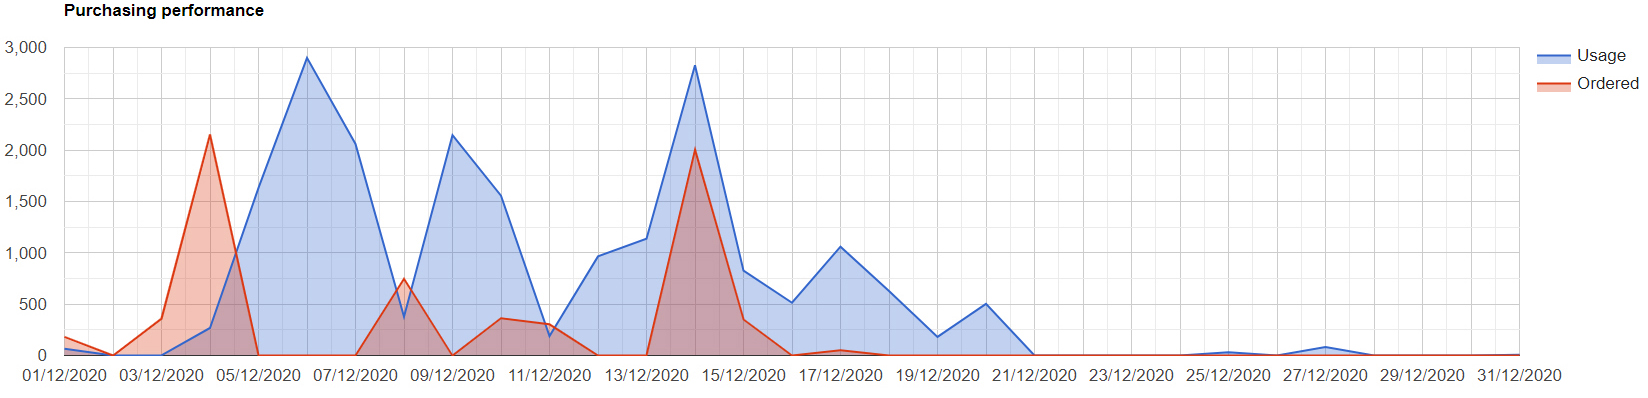
Line chart - used to analyse the performance of the purchasing department and also to help them identify any potential shortages. A line chart is generated to display the usage and order quantities for each day for the selected parts. Used in the Purchasing Performance EvoNET report.
VB.NET
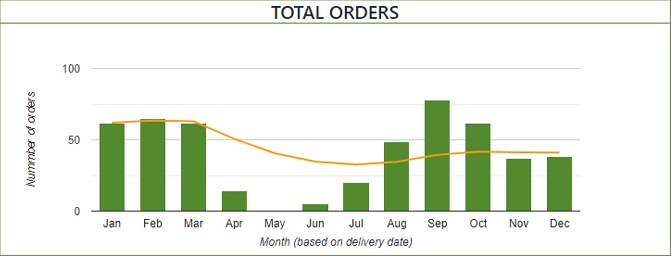
Combo chart - used in order to track the total orders for each month. Columns are used to display the total order amount and the line is used to display the average orders to indicate whether the tendency is for the orders to go up or down. Used in the CMS Portal's Dashboard page.
C#