1 / 1
Power BI helped CMS go onto another level with reporting. For some departments, reports have been created that allow them
to spot any issues and read data more efficiently. It helped the users to review at which areas in the factory most products fail,
see the potential profit of combined orders and pre-orders at a glance of an eye or simply understand more out of the data compared to table format reports in EvoNET or Excel.
Production
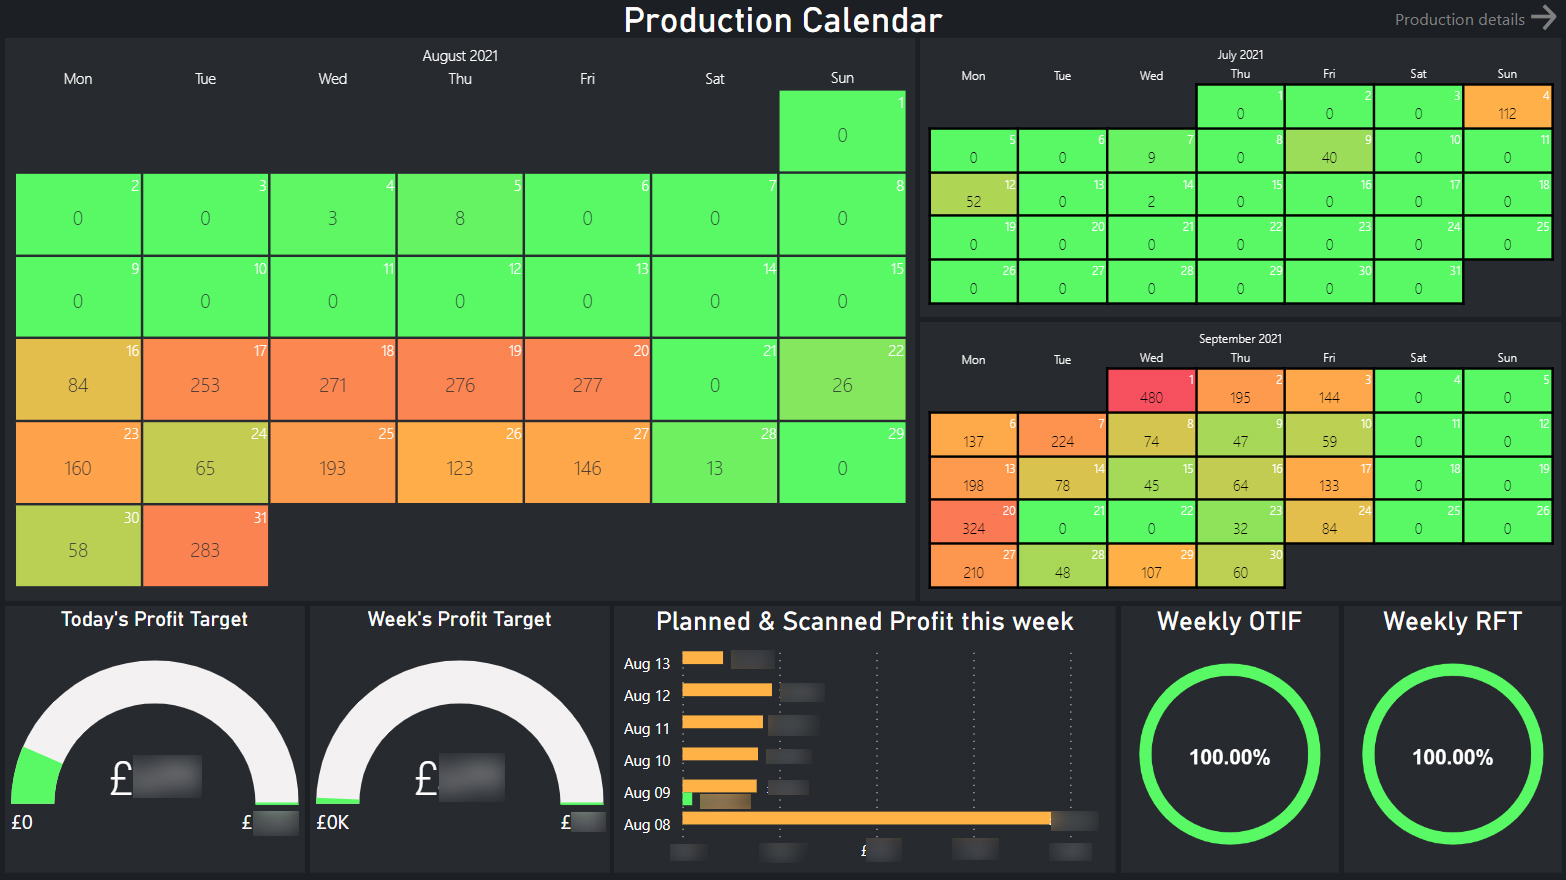
Production Calendar page has a full breakdown of the production calendar, including available stuff, production units per each fabricator
for specific days, scanned to planned profit and production units for the full week.
Production Details tab provides details for selected date of production and points the details about products such us OTIF,
average finish time, best and worst average finish product, fail reasons and locations. Moreover, the page displays the planned
and manufactured profit which is also then categorized by products. Finally, the page presents information about total production units scanned,
production units per hour and also the worst and best performers.
There are also Products, Remakes, Operators, Efficiency pages dedicated for a really comprehensive review of collected data that is
basically summed up on the Production Details page.
Operations
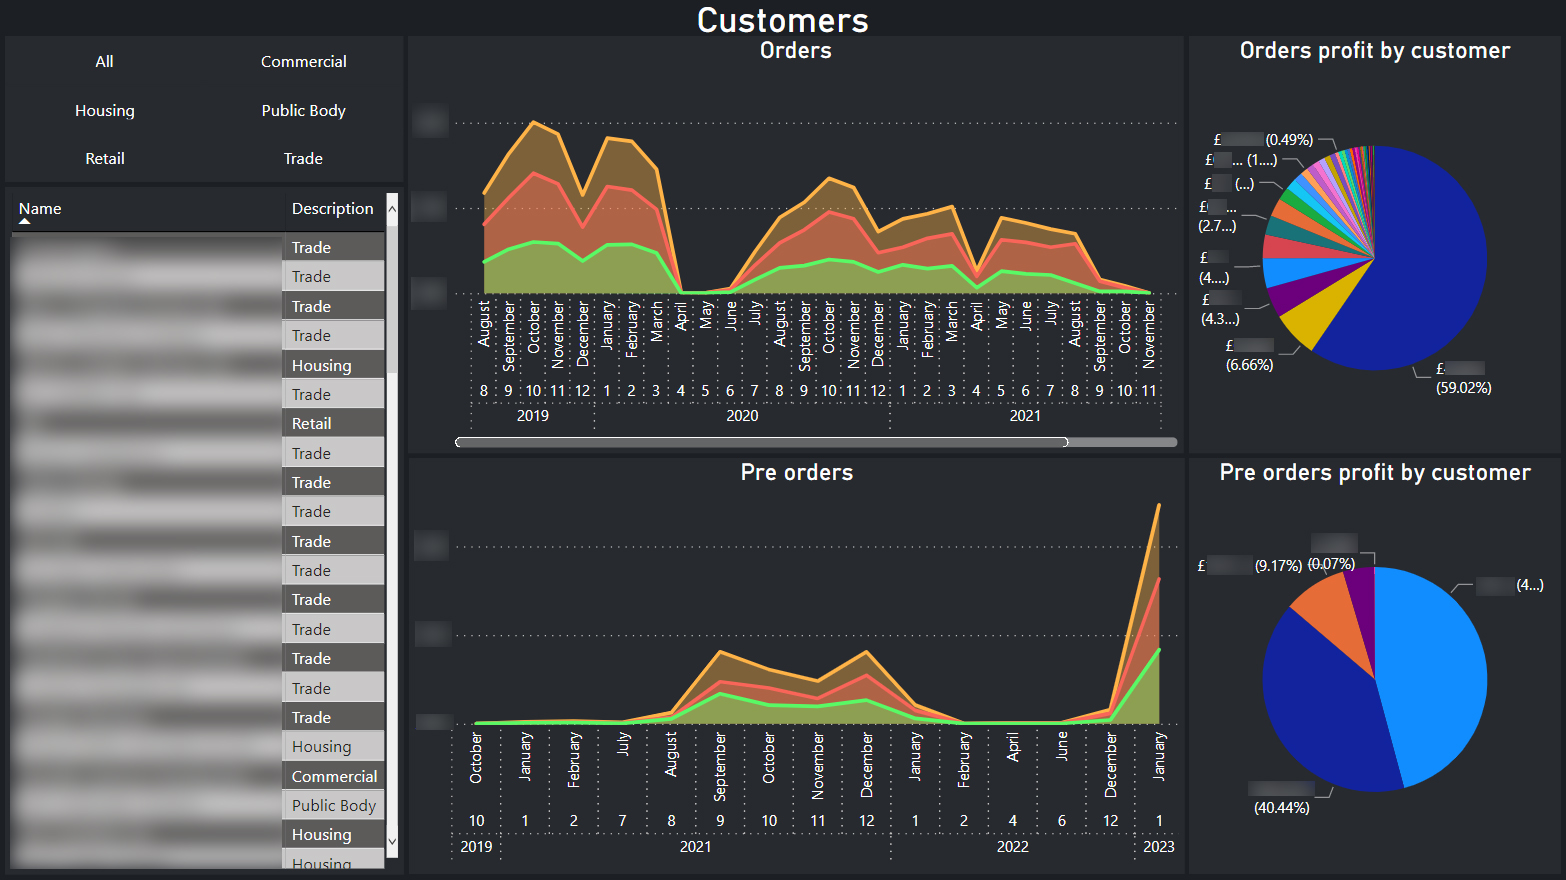
Customers page lets the user see orders and pre-orders amount and value for all, certain customers (e.g. CMS Enviro Ltd) or customer types (e.g. Housing).
Products tab lets the user compare OTIF, costs and profit values for each product CMS manufactures.
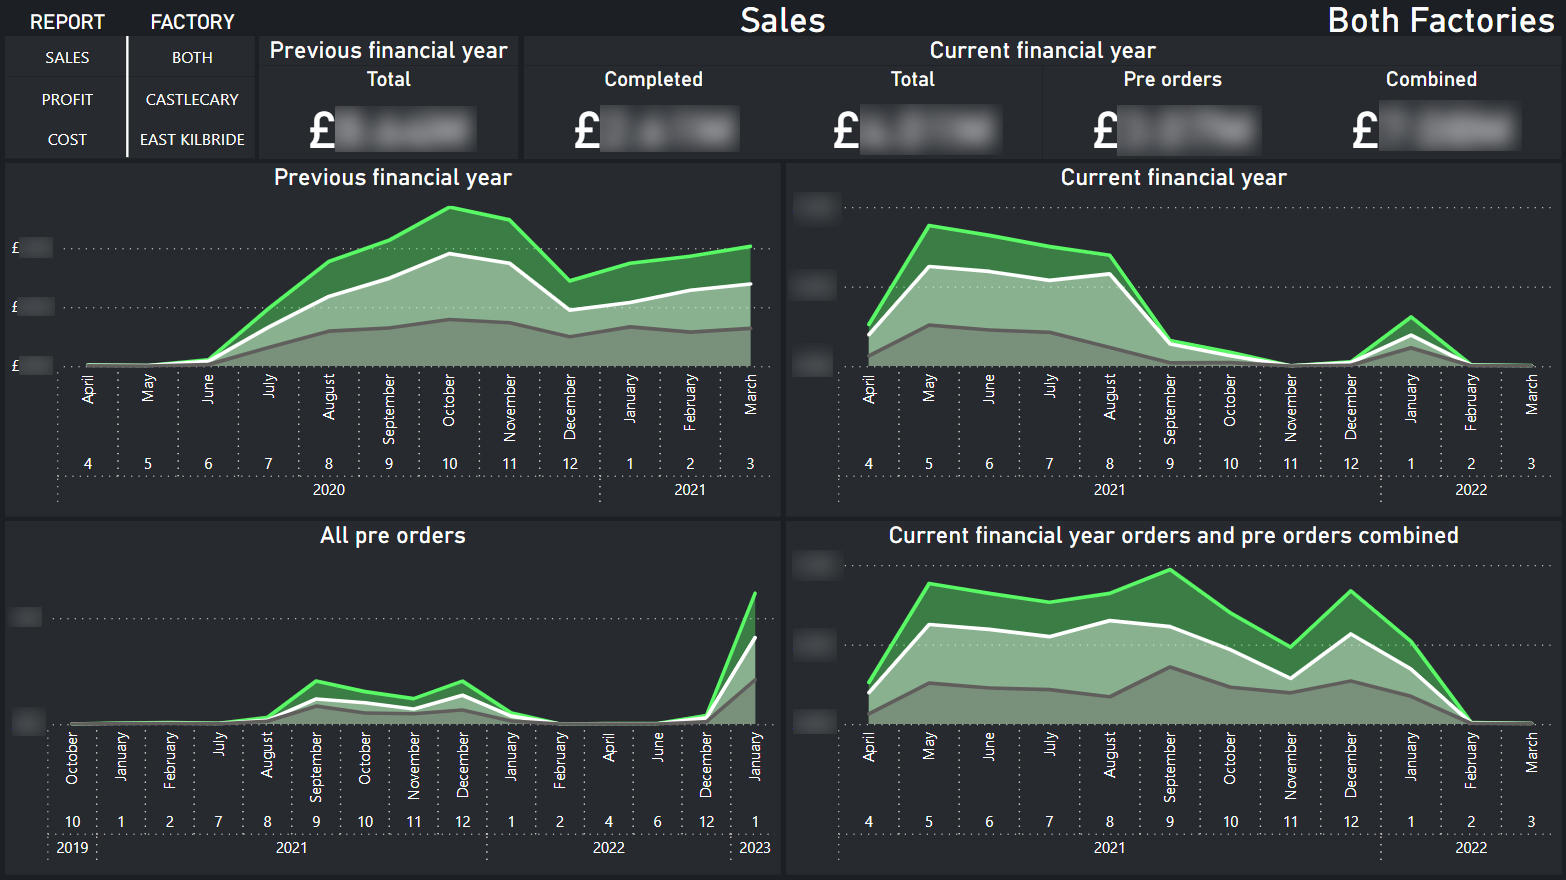
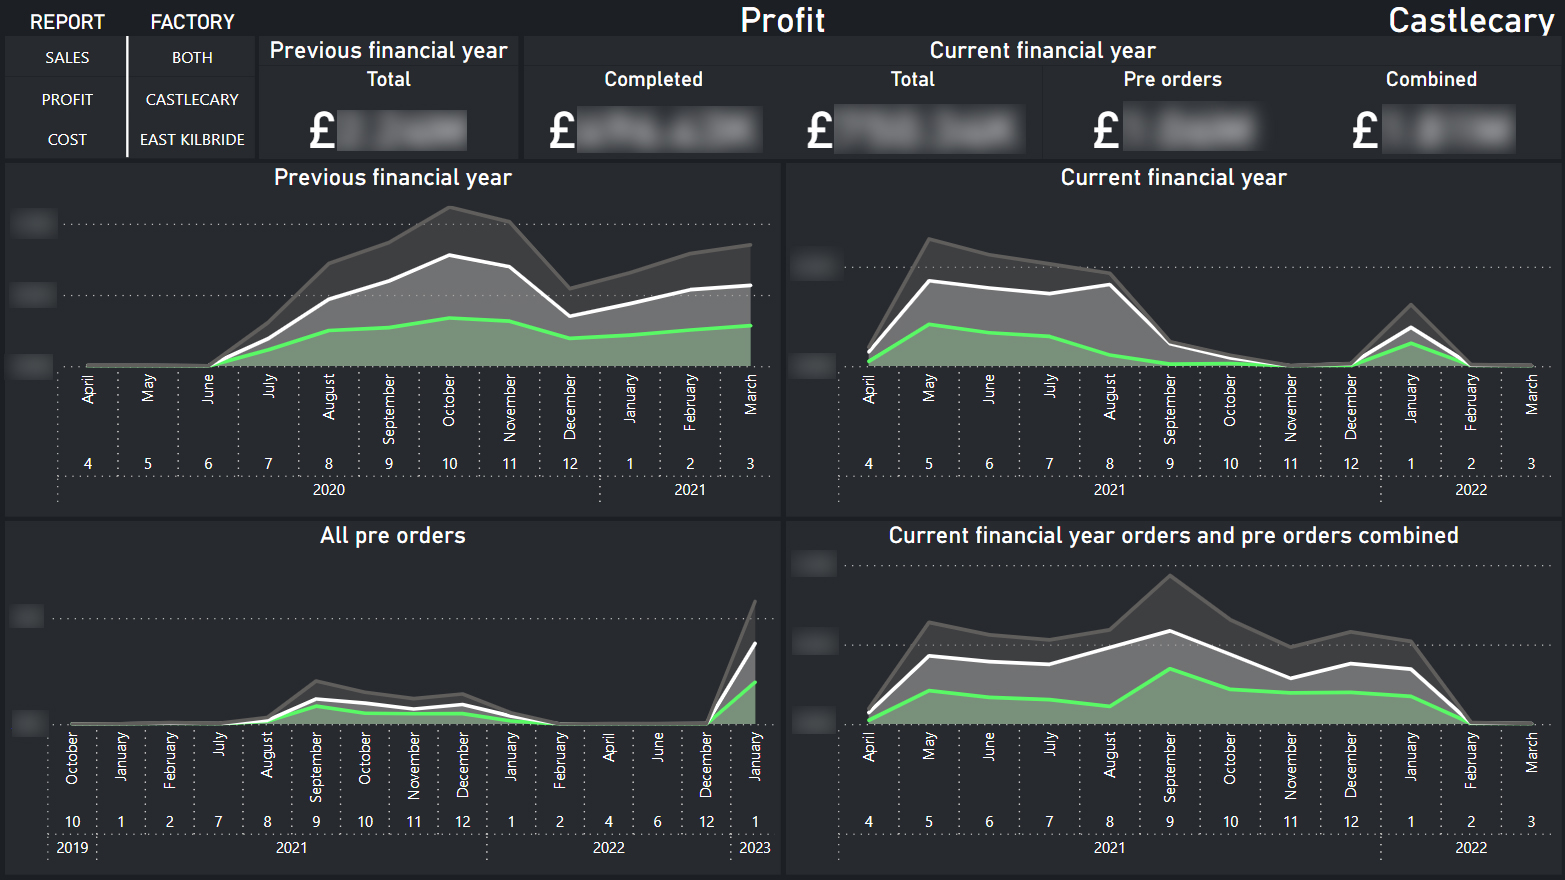
Sales, Profit and Cost pages are all about comparing current data with previous financial year. Apart from area charts
there are also totals displayed for each category. It is worth mentioning that pre-orders’ in the system only store the amount
of windows and doors the customer will require, therefore the sales price, profit and cost is predicted based on calculated averages
for each item, for each customer. This allows to get insights about possible future and act at the very early stages.
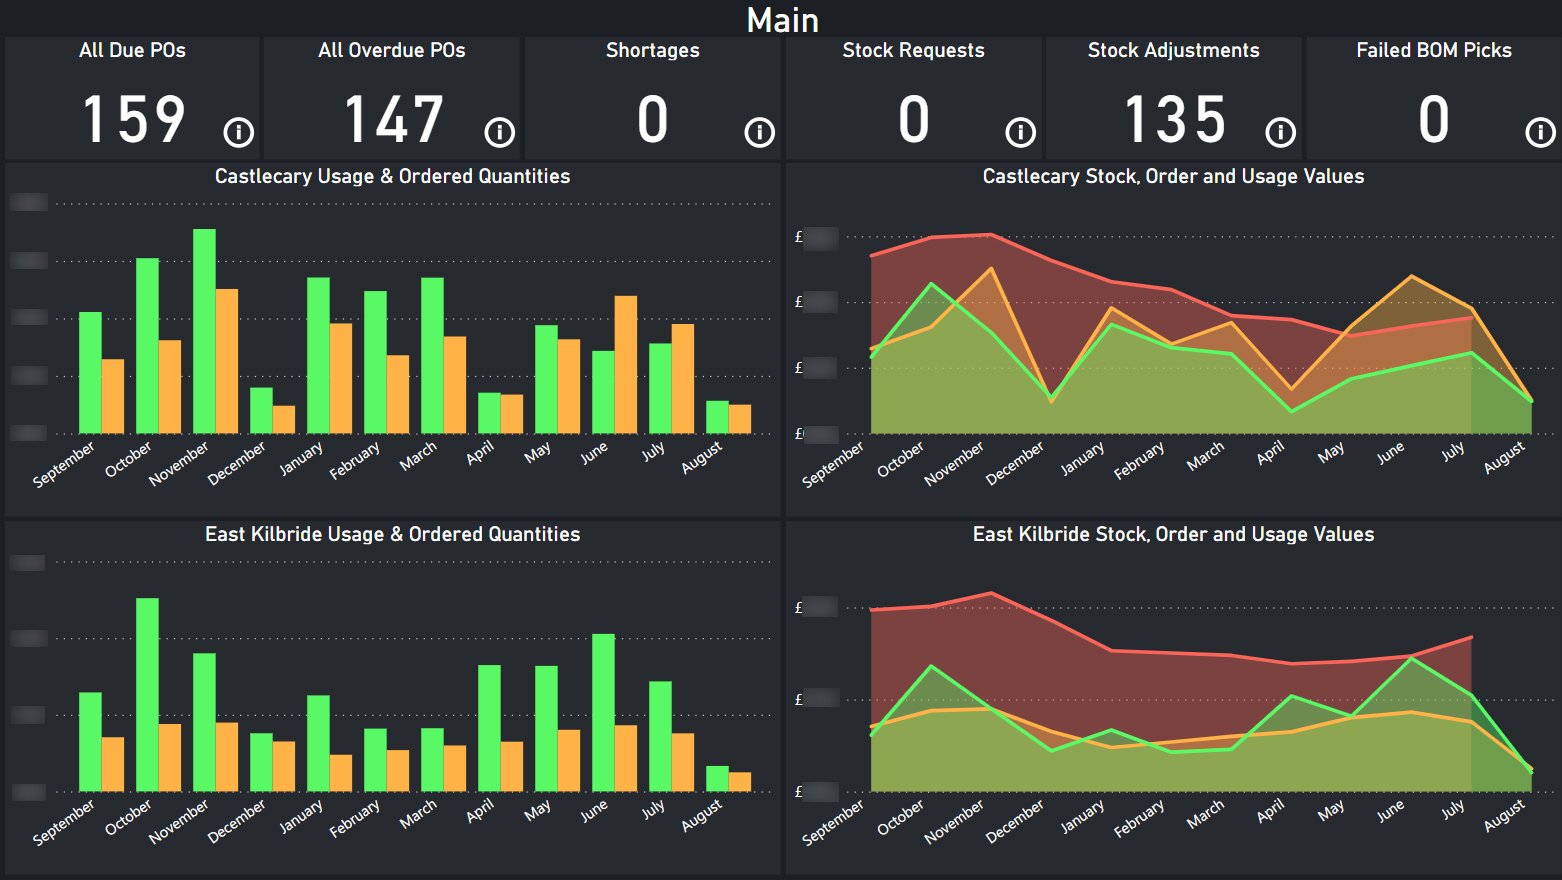
Stores and Purchasing
Main, landing page, allows to quickly gather the overall performance of stores and purchasing departments throughout the months by giving
a comparison of orders, usage and stock totals (quantities and values).
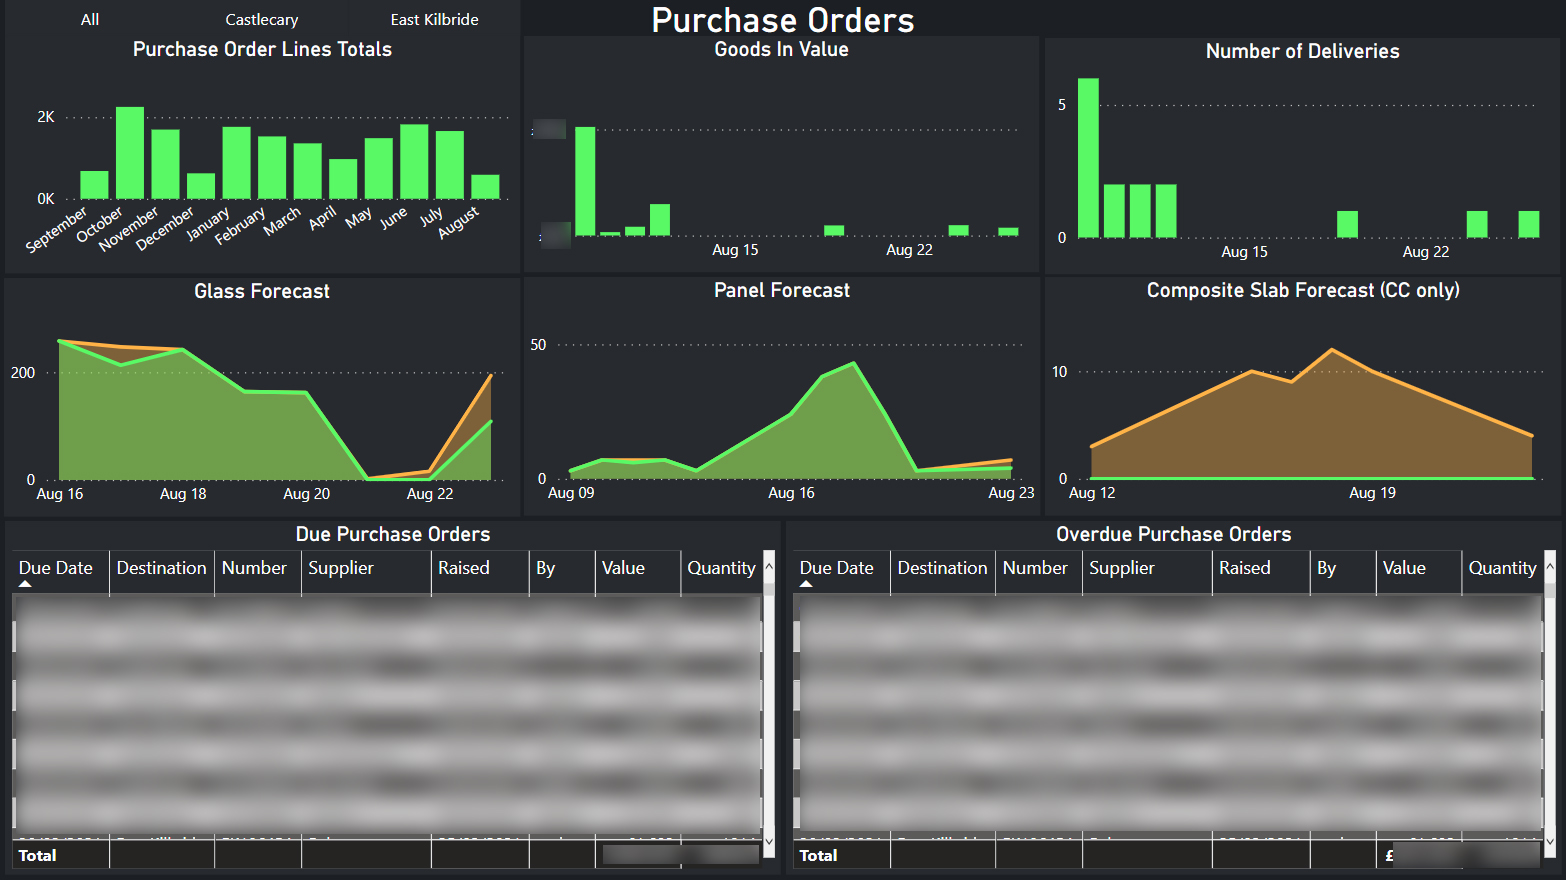
Purchase Orders tab is all about how many POs have been raised, whether required amount of glass, panels
and composite slabs have been ordered to fulfill production and also how many orders are due and overdue.
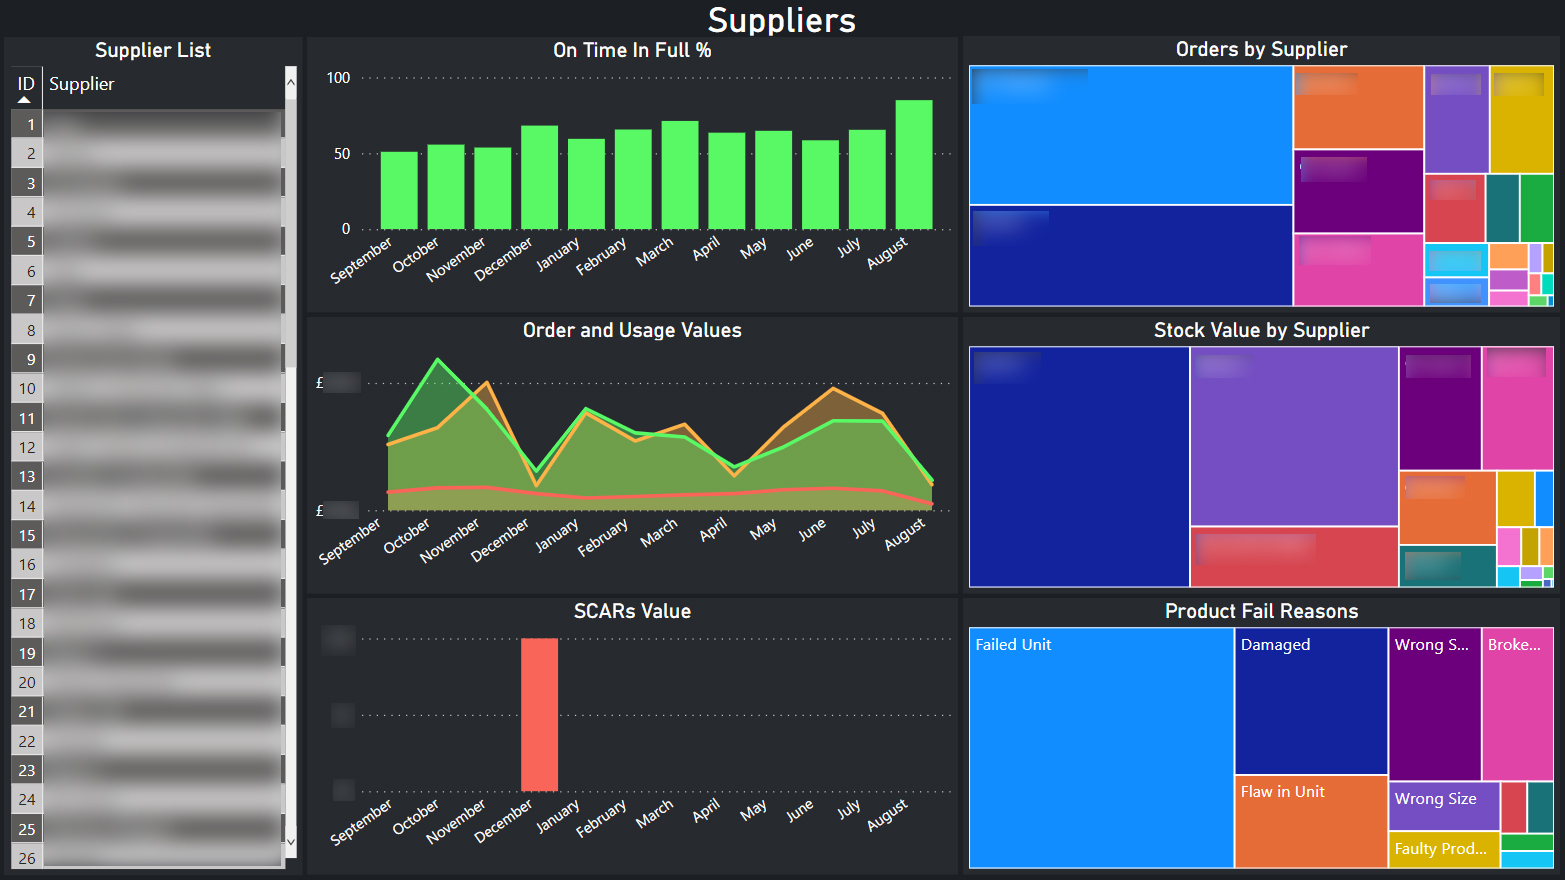
Suppliers page displays data about suppliers such as their OTIF, orders, SCARs and value of stock per each.
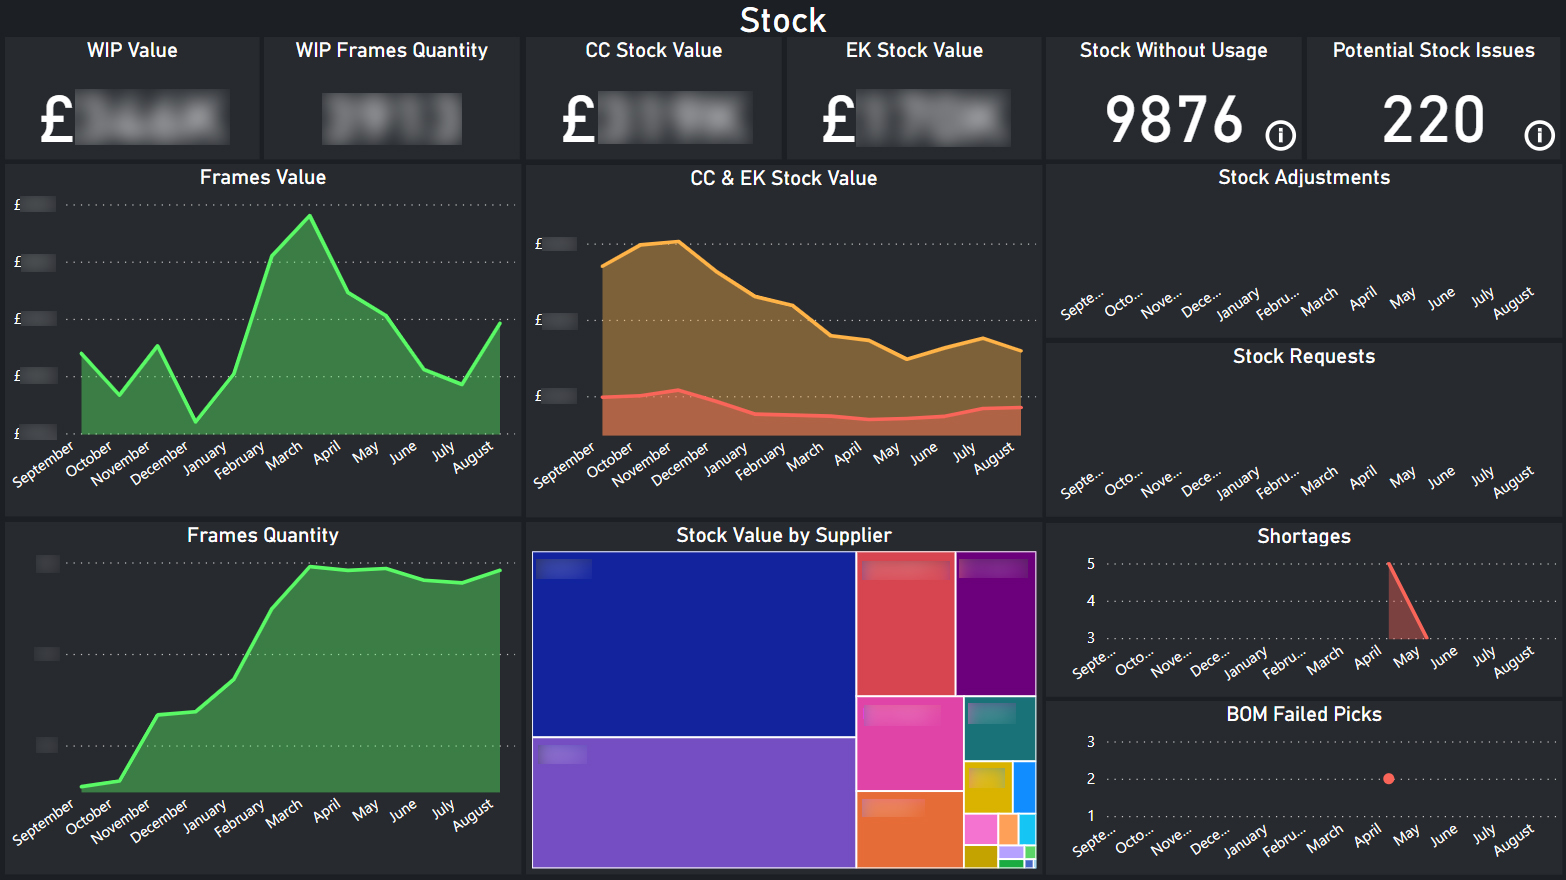
Stock tab displays an overview of WIP and current stock values and quantities and also any stock actions or issues that occured.