1 / 1
The KPI Web Application was created for one of Rubi's biggest customers. Up until the application was developed, the users were using linked reports (from Rubi's reporting module) in Excel files with complicated calculations.
Some users had issues operating these files, we received numerous support tickets asking for help or questioning data accuracy. Apart from designing and developing the whole back-end and front-end of the web application,
I directly liaised with the customer. I was in charge of all communication with the stakeholder - gathering the requirements, updating about progress and receiving feedback.
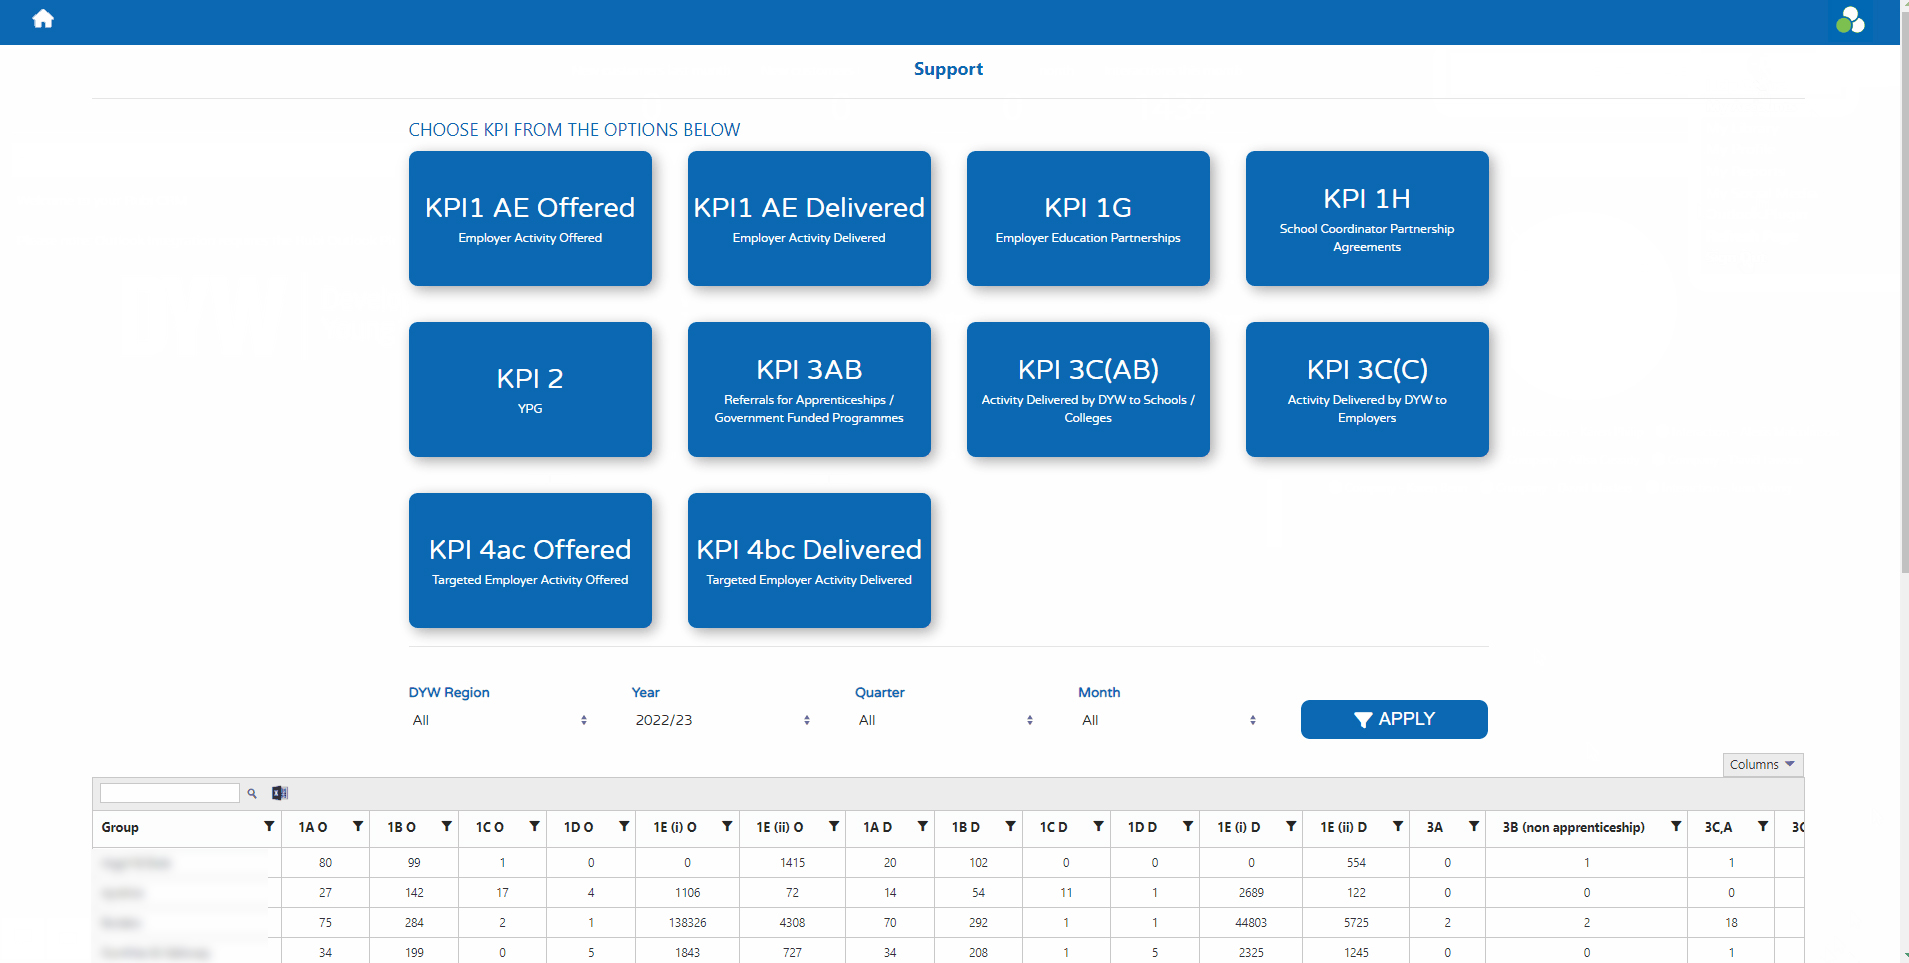
The landing page displays available KPI reports in 'tiles' format and main KPI report underneath. This report is a combination of most important statistics from all the KPIs.
The users are able to filter the data for specific region, year, quarter or month.
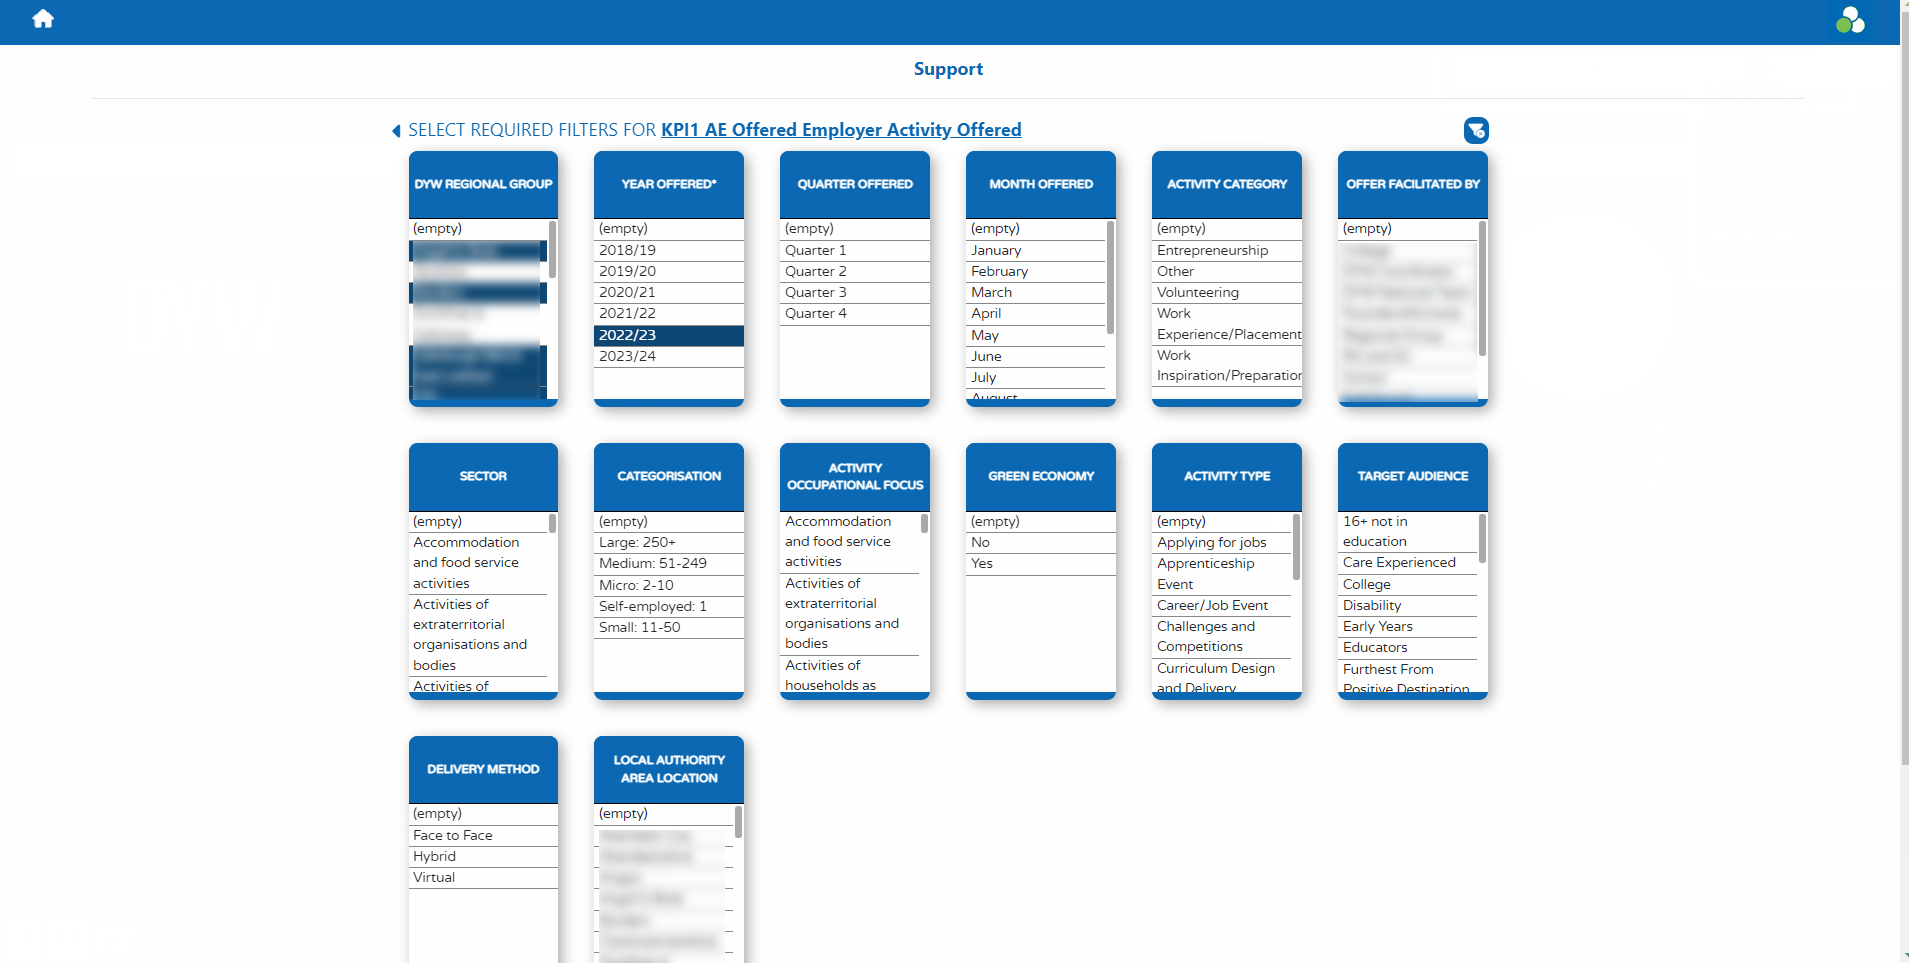
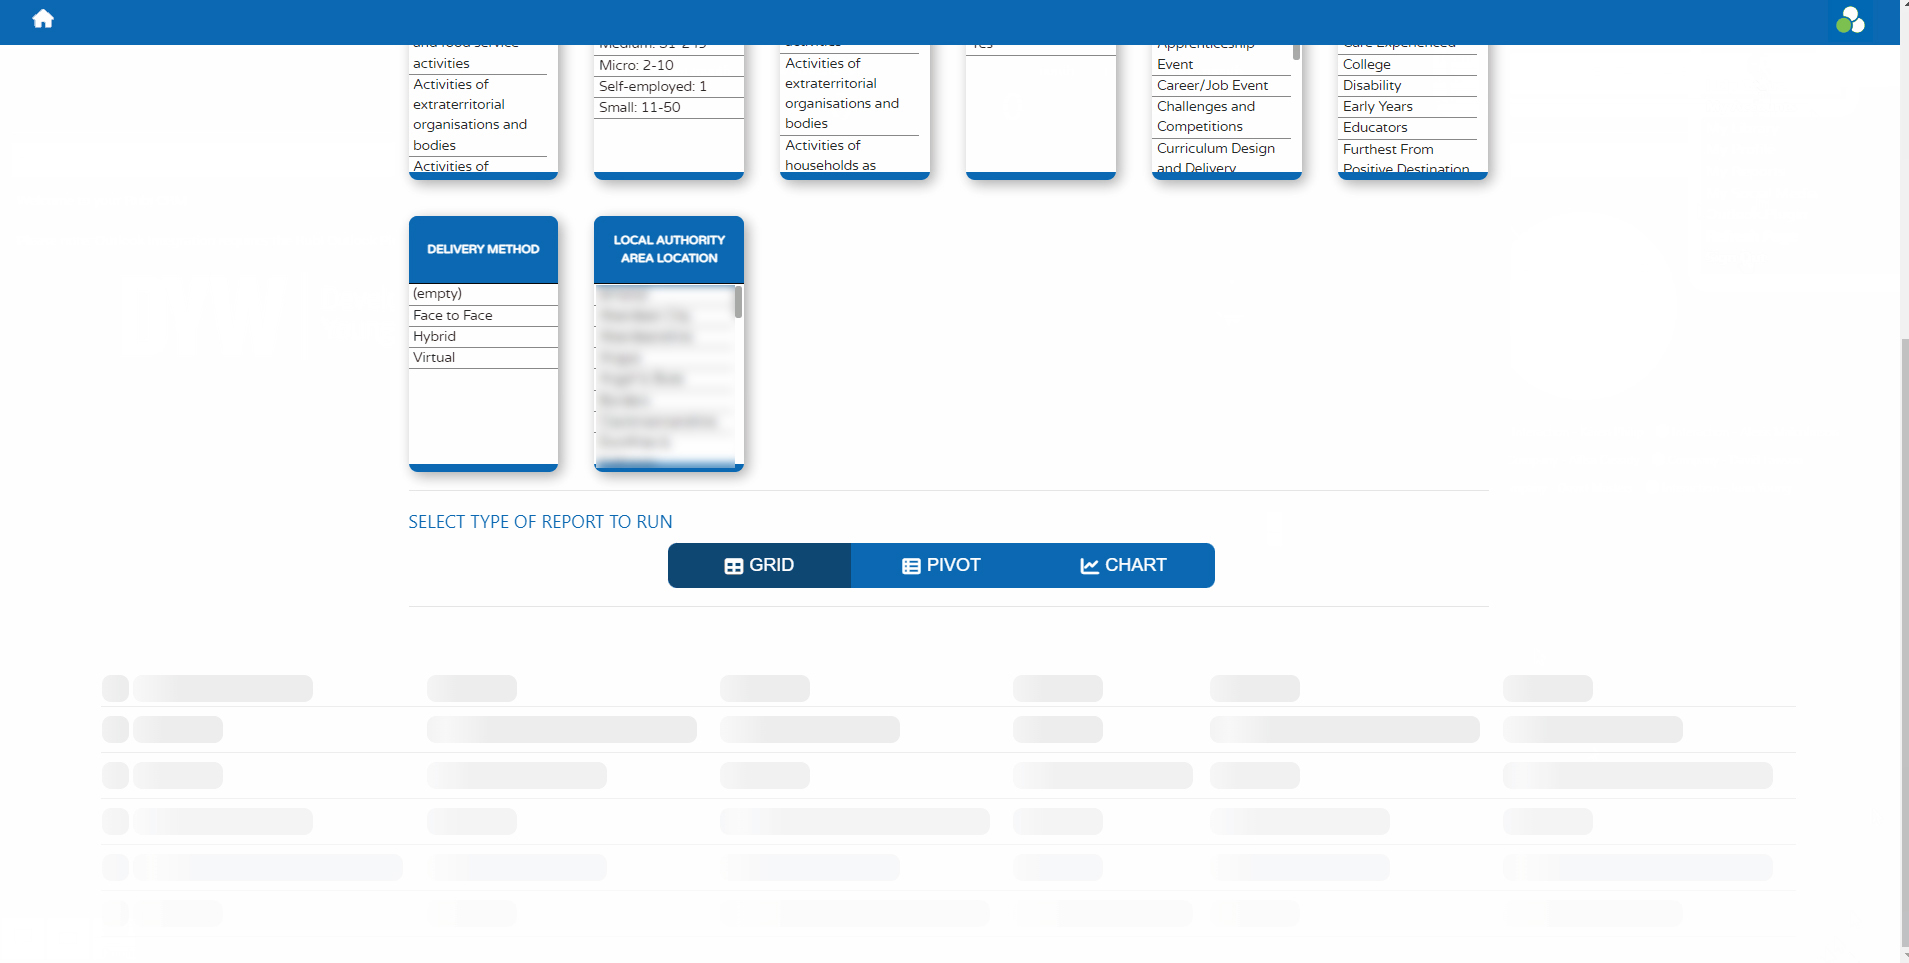
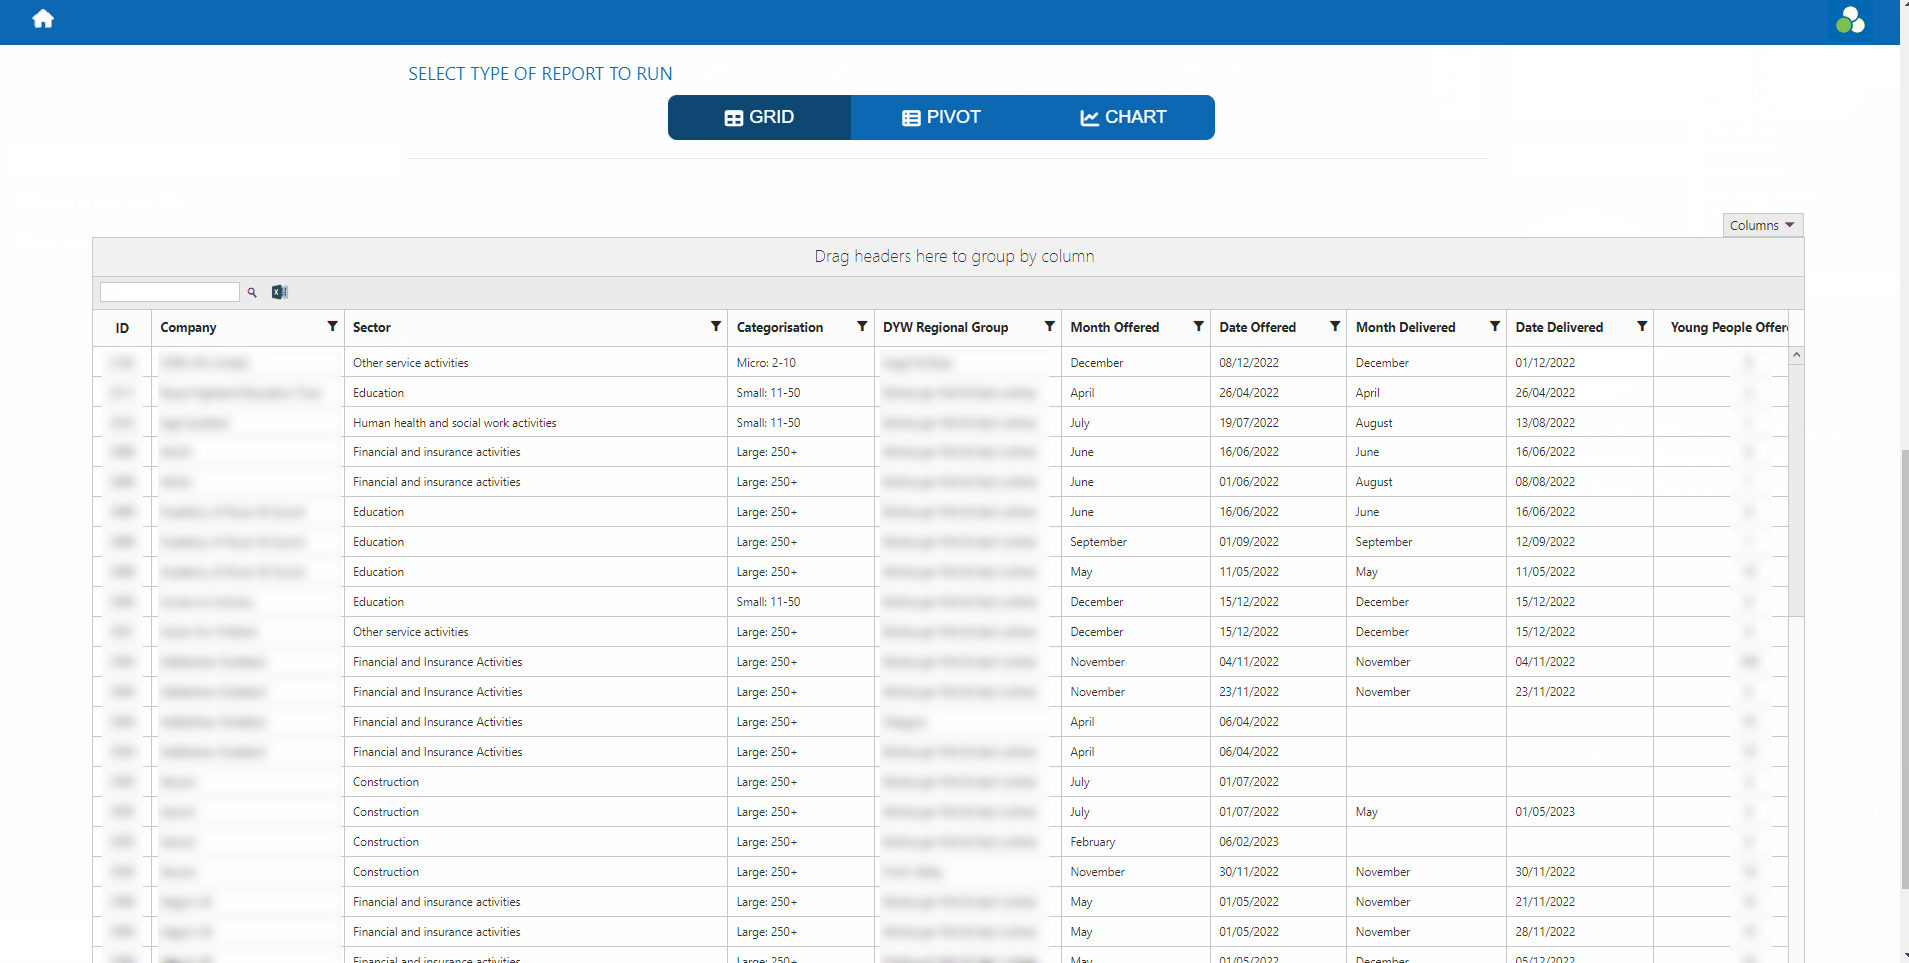
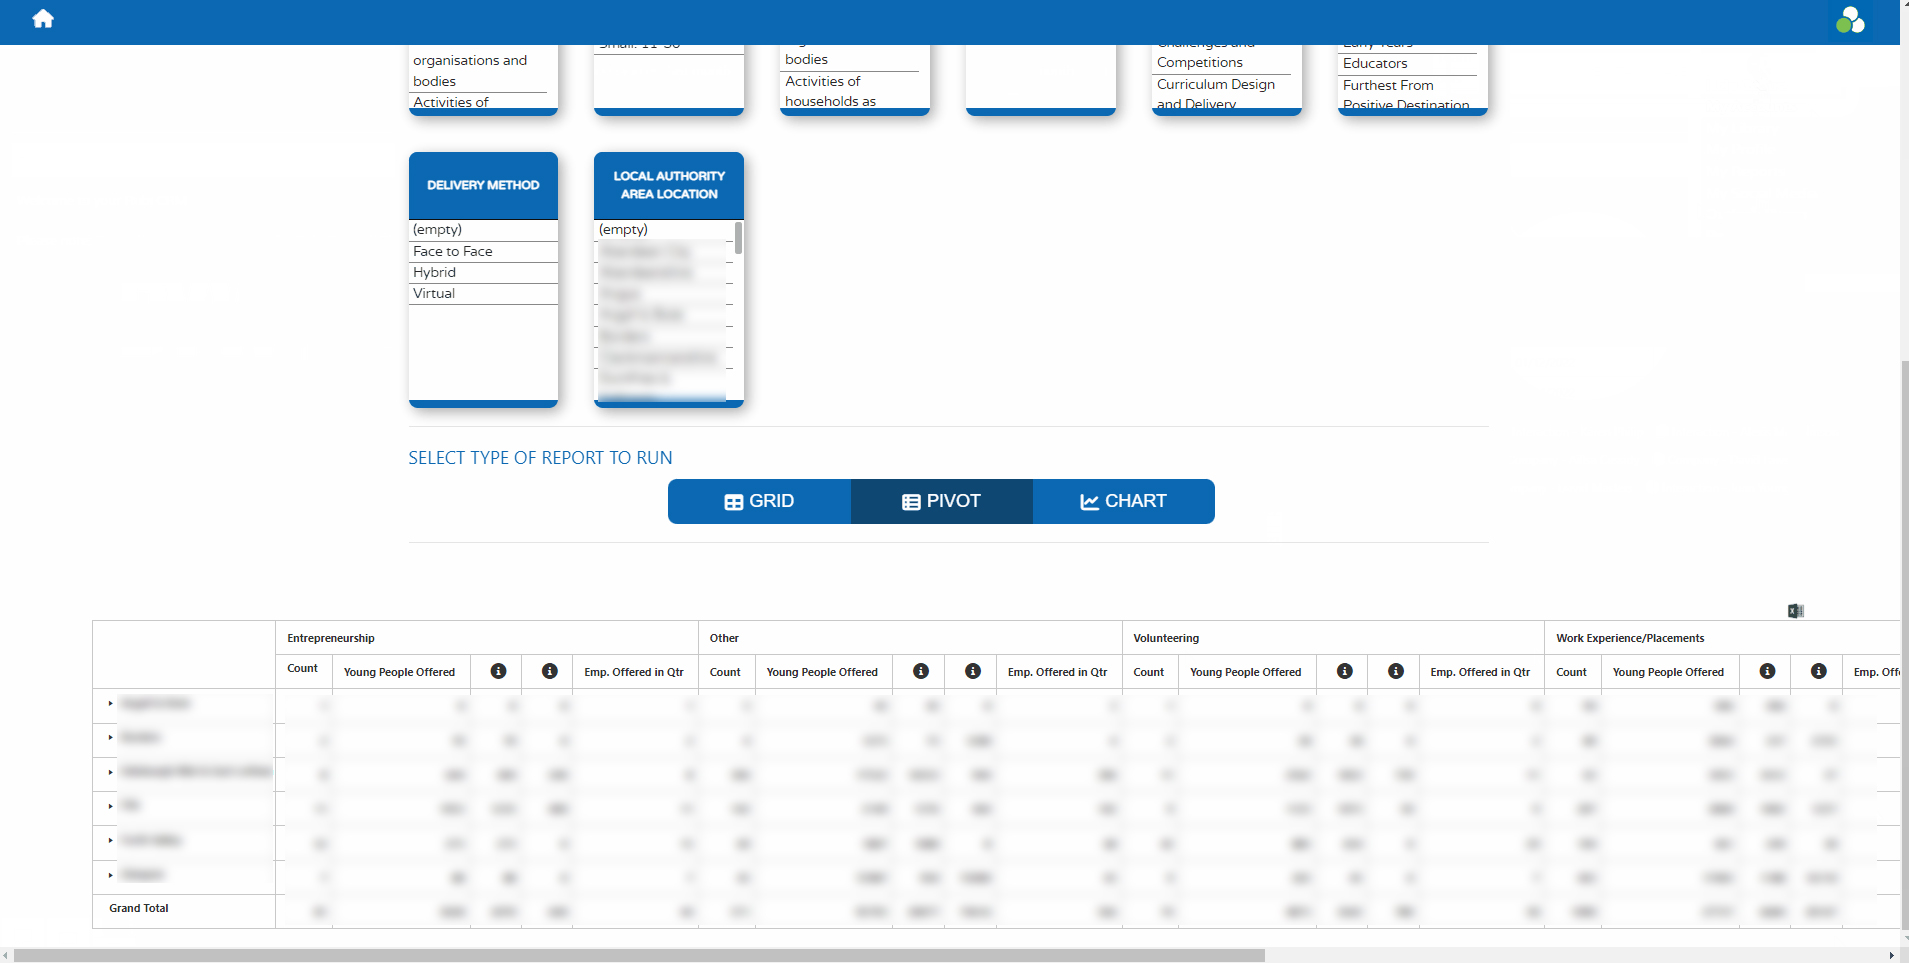
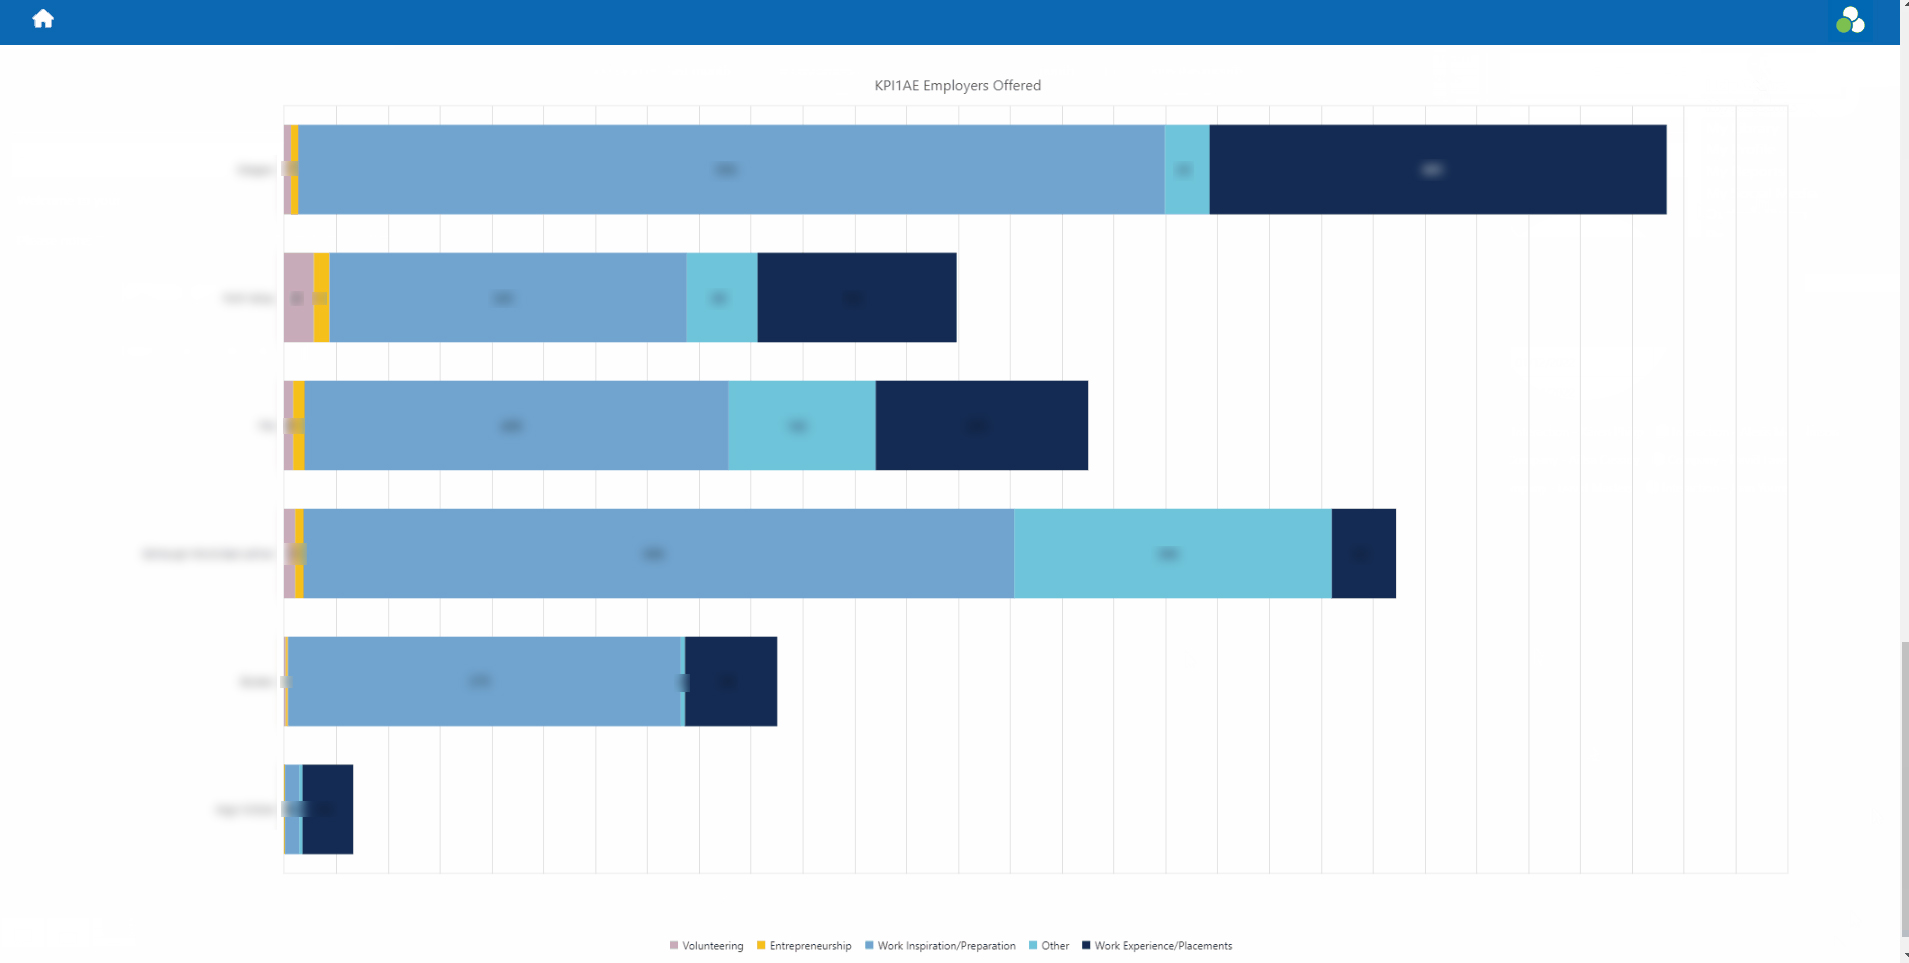
Once a report is chosen, the user is presented with available filters as they aren’t applicable to all KPIs. The user is able to select the desired format from the three options: